
The Cult of Statistical Significance — and the Neglect of Oomph
Statistical significance has little meaning when separated from practical importance
A central part of John Maynard Keynes’ explanation of the Great Depression was his assertion that household income affects household spending. When people lose their jobs and income, they cut back on their spending, which causes other people to lose their jobs and their income — propelling the economy downhill.
Keynes’ theory was based on logic and common sense. It was later tested empirically with household survey data and with national income data compiled by the National Bureau of Economic Research. Figure 1 shows U.S. after-tax personal income and consumer spending for the years 1929 through 1940. Since income and spending both tend to grow over time along with the population, the data were converted to annual percentage changes.
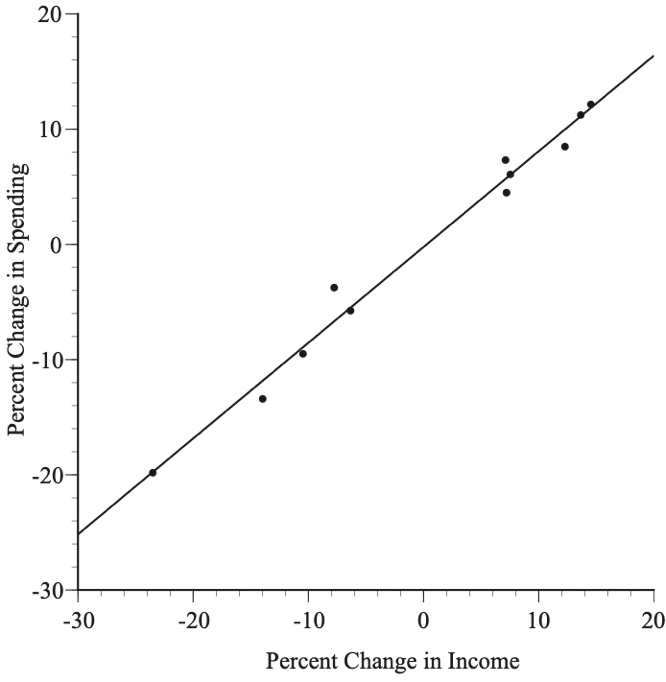
The observed statistical relationship is highly statistically significant. If there were no relationship between income and spending, the chances of a correlation as high as that shown in Figure 1 would be 0.000000002.
It is not all about statistical significance, however. Keynes’ argument hinges on changes in income having a substantial effect on spending. The slope of the line in Figure 1 is 0.83, which supports Keynes’ argument about the importance of the linkage between income and spending. Specifically, a 1 percent increase (or decrease) in income is predicted to increase (or decrease) spending by 0.83 percent.
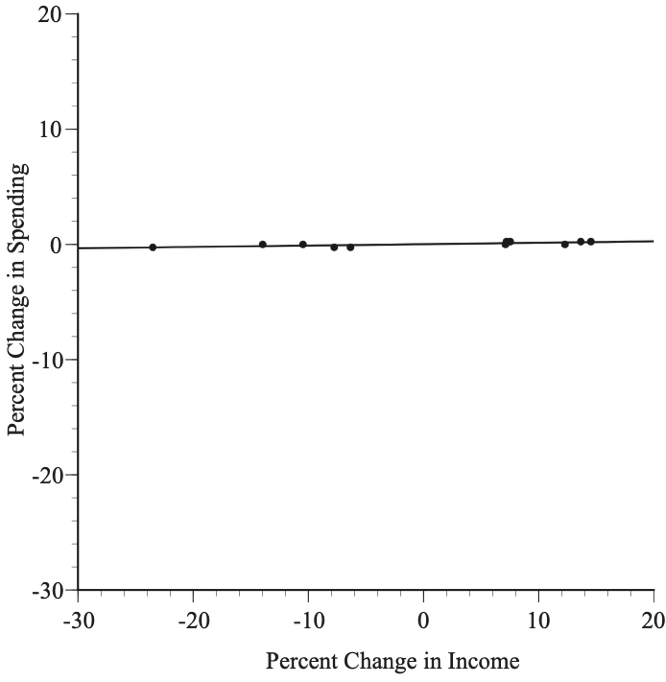
Suppose, however, that the data were those shown in Figure 2. The relationship is statistically significant, but the slope is only 0.01. When income goes up or down by 1 percent, spending is predicted to increase or decrease by a negligible one-hundredth of a percent, which would undercut Keynes’ argument completely.
Empirical studies should report both statistical persuasiveness and whether the estimated coefficients are substantial and plausible. It is not plausible that an increase in income would reduce spending or that it would increase spending by more than the increase in income. Thus, a statistically significant relationship between income and spending with a slope of –1.2 or +3.4 would be a reason for distress, not celebration. Instead of rushing off to publish counter-intuitive findings, we should investigate the reasons for the implausible results.
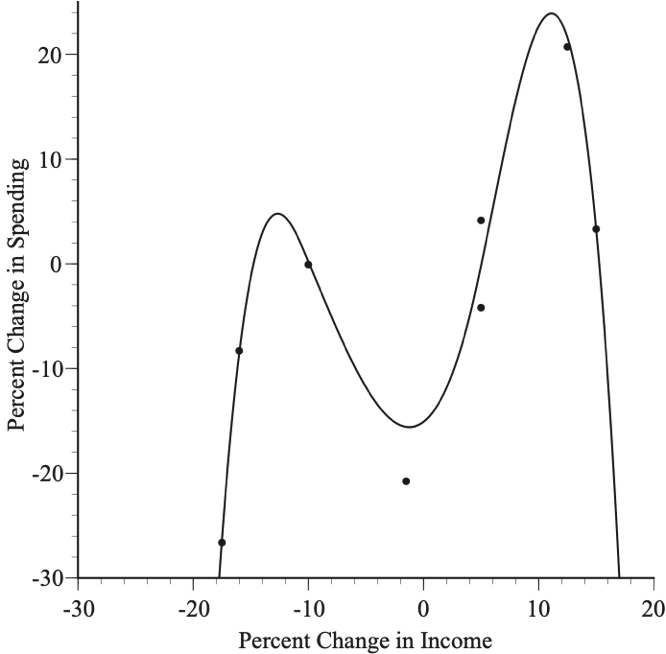
Figure 3 is another example — a fourth order polynomial that gives a good fit with every coefficient statistically significant. Yet, the model has clearly gone off the tracks — predicting that spending increases when there is a 12 percent drop in income and that spending falls when there is a 6 percent increase in income. When the data can be plotted in a simple scatter diagram, like Figure 3, it is obvious that, despite the statistically significant coefficients, the results are useless. However, these flaws are more difficult to detect in models with multiple explanatory variables. What is certain is that the success of a model cannot be assessed solely by looking at the statistical significance of the coefficients.
Economists have been criticized sharply and repeatedly by Deirdre McCloskey for confusing statistical significance with practical importance (what she calls “oomph”). A widespread focus on statistical significance rather than practical importance has also been found in dozens of papers published in the fields of psychology, education, and epidemiology.
Ananya Sen, Claire Van Note, and I analyzed 306 empirical papers that were published during the years 2010-2019 in MIS Quarterly, generally considered to be one of the top information systems journals, to see whether these papers were fixated on statistical significance at the expense of practical importance. They were.
We found that 78 percent of the papers used statistical significance alone to judge the success of their models. Many focused on counting the number of statistically significant results, with little concern for practical importance; for example, these authors reported statistical significance for nine of their ten hypotheses:
Table 5 summarizes the converged results of the model. As we can see, the fixed effects of apps, off-hour accesses, conf, off-site accesses, and log(DeptSize) all significantly support H1, H2, H3, H4, and H5(a). The cross-level interaction terms are significant, except Apps*Log(DeptSize), therefore supporting H6(c), H6(d) H6(e), and H6(f), but not H6(b).
Where’s an assessment of the oomph? Nowhere to be seen.
Another study investigated the factors affecting German household decisions to adopt smart metering technology (SMT) for monitoring electricity consumption. One factor they considered was household income: “Consumers with higher income are able to spend on environmental friendly devices such as SMT and are more likely to adopt it,” but the researchers do not say how much more likely — they do not consider the practical importance of their findings. Nor did their paper give enough information for readers to judge for themselves.
The authors write that, “Intention is the subjective probability that a person will perform a certain behavior;” however, I contacted the authors and learned that their intention variable is not a probability but, instead, the average value of each household’s response to three questions on a Likert scale of 1–7. Similarly, the income explanatory variable is defined as “the average income of the consumers,” but we are not told whether it is weekly, monthly, or annual income and whether the data are recorded in euros, thousands of euros, or some other unit. It turns out that the data are monthly income measured in thousands of euros. All this detective work yields our oomph answer: a 1000-euro increase in monthly household income is predicted to increase a household’s intention to adopt SMT on a 1–7 Likert scale by a trifling 0.062.
There are two related problems with a myopic focus on statistical significance. First, it encourages data mining and data torturing in a quest for statistically significant results. Second, models that are judged by statistical significance rather than the plausibility of the coefficients are apt to fare poorly with fresh data.
This misplaced focus on statistical significance is an inherent weakness of deep neural networks and other black box models, since computer algorithms do not understand the world in any relevant sense and consequently cannot assess oomph or plausibility. Black box algorithms would happily choose the useless fourth-order polynomial in Figure 3.
Sound reliable empirical analyses are enhanced by de-emphasizing statistical significance and focusing, instead, on expert assessments of a model’s credibility and oomph.